Profiling Go in Kubernetes

In Kubernetes 1.23 the new ephemeral containers API went in to beta and in 1.25 it became stable. Ephemeral containers or debug containers as it is also known as, makes it's possible to inject a container into an already running pod without restarting it. This is very useful when you want to debug your application since the ephemeral container can provide tools that you don't want in your application container.
In this post I thought we could go trough how to profile a running container in Kubernetes.
Application
To get started lets use a very simple test application written by the team over at Polar Signals.
They have been kind enough to publish a container image and a Kubernetes deployment that we will use. The application is built in such a way that it will continue to use memory and the Kubernetes yaml don't contain any request nor limit so don't run this for a long time or your system will probably OOM.
Run the application on Kubernetes 1.23 or higher.
kubectl apply -f https://raw.githubusercontent.com/polarsignals/pprof-example-app-go/main/manifests/deployment.yaml
For starters lets have a look at the pprof http endpoint using curl. A simple way of doing so is to create a Kubernetes service and reach the pod from another container.
# Expose the pprof deployment
kubectl expose deployment pprof-example-app-go --port=8080
Create a curl pod and look at the data inside our app.
kubectl run -i -t curl --image=curlimages/curl:latest /bin/sh
You will be sent directly in to the container and you can run something like:
curl http://pprof-example-app-go:8080/debug/pprof/allocs?debug=1
This will show you an output that look something like this:
heap profile: 4: 47357952 [5473: 554303632] @ heap/1048576
1: 46882816 [1: 46882816] @ 0x697585 0x470ce1
#	0x697584	main.allocMem+0xa4	/home/brancz/src/github.com/polarsignals/pprof-example-app-go/main.go:65

1: 212992 [1: 212992] @ 0x4e3b6e 0x4e3e6c 0x6974c5 0x470ce1
#	0x4e3b6d	log.(*Logger).Output+0x38d	/usr/local/go/src/log/log.go:180
#	0x4e3e6b	log.Println+0x6b		/usr/local/go/src/log/log.go:329
#	0x6974c4	main.calculateFib+0xc4		/home/brancz/src/github.com/polarsignals/pprof-example-app-go/main.go:55

1: 204800 [1: 204800] @ 0x4fb68f 0x4fb256 0x503d3d 0x502c97 0x4f6d5e 0x4f6c92 0x4d22a5 0x4d2625 0x4d70b1 0x4cf3d2 0x4e3e3f 0x6974c5 0x470ce1
#	0x4fb68e	math/big.nat.make+0x5ee		/usr/local/go/src/math/big/nat.go:69
#	0x4fb255	math/big.nat.sqr+0x1b5		/usr/local/go/src/math/big/nat.go:595
Sadly this output isn't the easiest to read so why not use pprof and while we are at it why not use ephemeral containers.
Debug container/ephemeral container
My original plan for this blog post was to attach a new volume to the ephemeral container so we could save data locally and then copy it out to our client and show some nice flame graphs. But apparently it's not supported to attach volumes to the ephemeral container. The ephemeral container cannot even reach the existing volumes on the pod you attach to.
There is an open issue to solve this but it's not part of the current enhancement proposal so this is nothing that we will see in the near future.
So instead I will just show how we can debug using pprof from within the container. Since we exposed the endpoint through a service we could of course do this from another pod as well. But in general you should be very restrictive of what traffic that can reach your pprof endpoint if you expose it at all.
So finally time to use the kubectl debug command.
The debug command is used on a specific pod, in my case it's pprof-example-app-go-7c4b6d77d-xw52p.
Let's attach a standard golang container to our running pod, in this case i choose golang 1.15 to match the pprof tool with the running application.
Kubernetes will attach the container for you and give you a shell.
kubectl debug -i -t pprof-example-app-go-7c4b6d77d-xw52p --image=golang:1.15-alpine3.14 -- /bin/sh
Now we can point on localhost using pprof.
go tool pprof http://localhost:8080/debug/pprof/allocs
This will provide you with a pprof terminal inside the container.
I'm no pprof pro but there are some easy commands to get you started.
top 10 -cum will show you the resource consumption it takes to call a function including all function it calls
top 10 -cum
Showing nodes accounting for 27.63GB, 99.80% of 27.69GB total
Dropped 26 nodes (cum <= 0.14GB)
Showing top 10 nodes out of 17
      flat  flat%   sum%        cum   cum%
         0     0%     0%    25.66GB 92.69%  main.calculateFib
   25.59GB 92.43% 92.43%    25.59GB 92.43%  math/big.nat.make (inline)
         0     0% 92.43%    25.41GB 91.78%  github.com/polarsignals/pprof-example-app-go/fib.Fibonacci
         0     0% 92.43%    25.41GB 91.78%  math/big.(*Int).Add
         0     0% 92.43%    25.41GB 91.78%  math/big.nat.add
    2.02GB  7.30% 99.73%     2.02GB  7.30%  main.allocMem
    0.02GB 0.073% 99.80%     0.25GB  0.91%  fmt.Sprintln
         0     0% 99.80%     0.25GB  0.91%  log.Println
         0     0% 99.80%     0.23GB  0.84%  fmt.(*pp).doPrintln
         0     0% 99.80%     0.23GB  0.84%  fmt.(*pp).handleMethods
top 10 -flat will show you the resource consumption it takes to call a function excluding all function it calls
Active filters:
   ignore=flat
Showing nodes accounting for 27.66GB, 99.90% of 27.69GB total
Dropped 10 nodes (cum <= 0.14GB)
Showing top 10 nodes out of 17
      flat  flat%   sum%        cum   cum%
   25.59GB 92.43% 92.43%    25.59GB 92.43%  math/big.nat.make (inline)
    2.02GB  7.30% 99.73%     2.02GB  7.30%  main.allocMem
    0.03GB   0.1% 99.83%     0.21GB  0.76%  math/big.nat.itoa
    0.02GB 0.073% 99.90%     0.25GB  0.91%  fmt.Sprintln
         0     0% 99.90%     0.23GB  0.84%  fmt.(*pp).doPrintln
         0     0% 99.90%     0.23GB  0.84%  fmt.(*pp).handleMethods
         0     0% 99.90%     0.23GB  0.84%  fmt.(*pp).printArg
         0     0% 99.90%    25.41GB 91.78%  github.com/polarsignals/pprof-example-app-go/fib.Fibonacci
         0     0% 99.90%     0.25GB  0.91%  log.Println
         0     0% 99.90%    25.66GB 92.69%  main.calculateFib
By looking at the output we can see that it's math/big.nat.make that takes the most resources.
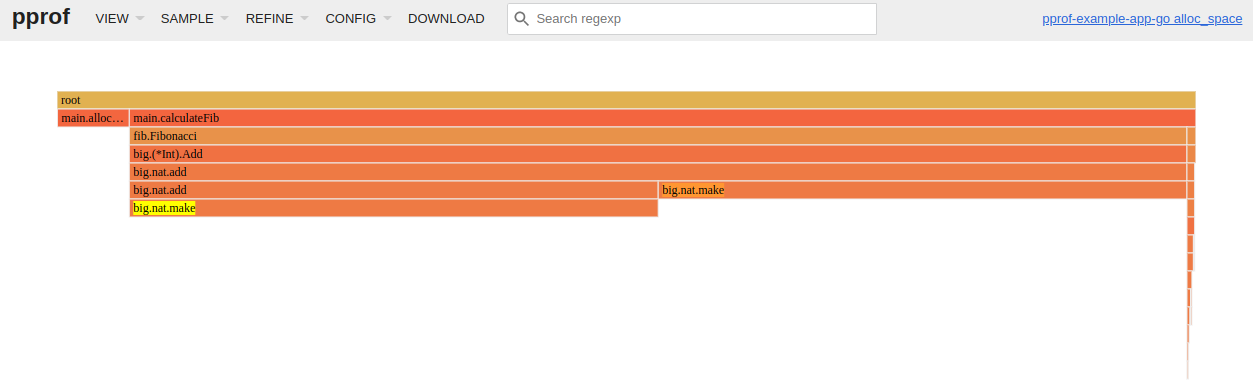
Just for fun I also generated a flame graph using pprof by port-forwarding to the application and running
go tool pprof -http=: http://localhost:8080/debug/pprof/allocs
Cleanup
To cleanup the resources we created run:
kubectl delete -f https://raw.githubusercontent.com/polarsignals/pprof-example-app-go/main/manifests/deployment.yaml
kubectl delete svc pprof-example-app-go
kubectl delete pod curl
Conclusion
The kubectl debug command is extremely useful when you want to debug your application and you
don't have access to a shell or the tools that you need in your normal container.
It saves us from having to install unneeded applications in our container which lowers the amount of potential CVE:s and the time it takes to start your container by lower container size. Kubectl debug isn't perfect and it won't work for all your uses cases especially since you can't use it to interact with existing volumes but it's a great start.
When it comes to continues profiling it's probably better to look at tool specifically written for it like Grafana Phlare or Parca. But using a tool like pprof locally can be a good start. Hopefully we will get time to write a blog about continues profiling in the future.