Observability
What is observability?
Within observability we normally talk about three pillars.
- metrics
- logging
- tracing
Monitoring applications is an especially important feature when developing microservices and something that all developers of microservices needs to focus on.
We currently support two solutions to gather observability data in XKF, Datadog and the Opentelemetry stack which is an open-source solution.
Datadog
When Datadog monitoring is used the Datadog Operator will be added to your cluster. On top of deploying a Datadog agent to every node to collect metrics, logs, and traces it also adds the ability to create Datadog monitors from the cluster. The Datadog agent handles all communication with the Datadog API meaning that individual applications do not have to deal with things such as authentication.
Logging
All logs written to stdout and stderr from applications in the tenant namespace will be collected by the Datadog agents. This means that no additional
configuration has to be done to the application, other than making sure the logs are written to the correct destination.
This means that kubectl logs and Datadog will display the same information.
Check the official Datadog Logging Documentation for more detailed information.
Metrics
Datadog can collect Prometheus or OpenMetrics metrics exposed by your application. In simple terms this means that the application needs to expose an endpoint which the Datadog agent can scrape to get the metrics. All that is required is that the Pod contains annotations which tells Datadog where to find the metrics HTTP endpoint.
Given that your application is exposing metrics on port 8080 your pod should contain the following annotations.
annotations:
  ad.datadoghq.com/prometheus-example.instances: |
    [
      {
        "prometheus_url": "http://%%host%%:8080/metrics"
      }
    ]
Check the official Datadog Metrics Documentation for more detailed information.
Tracing
Datadog tracing is done with Application Performance Monitoring (APM), which sends traces from an application to Datadog. For traces to work the application needs to be configured with the language specific libraries. Check the Language Documentation for language specific instructions. Some of the languages that are supported are.
- Golang
- C#
- Java
- Python
Configure your Deployment with the DD_AGENT_HOST environment for the APM agent to know where to send the traces.
apiVersion: apps/v1
kind: Deployment
spec:
  containers:
    - env:
        - name: DD_AGENT_HOST
          valueFrom:
            fieldRef:
              fieldPath: status.hostIP
Check the official Datadog Tracing Documentation for more detailed information.
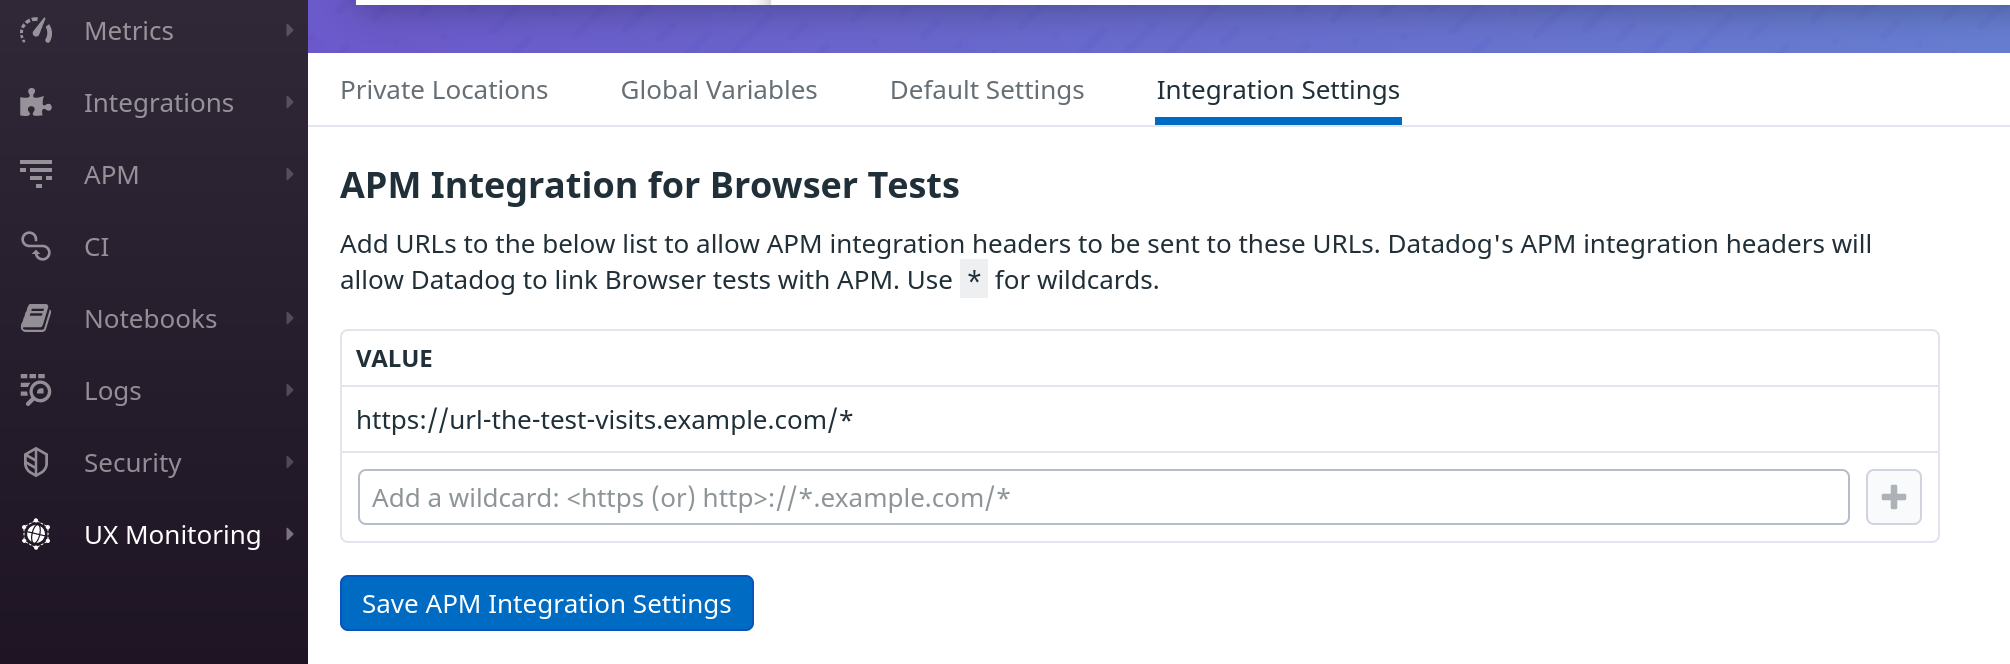
To add tracing to Datadog's Browser Test results, add the URLs that the browser tests visits under UX Monitoring/Synthetic Settings/Integration Settings. See Synthetic APM for more information. You can see a example on how to set this up below. By using a wildcard, multiple endpoints can be traced.
Networkpolicy datadog
When using XKF and your cluster has Datadog enabled the tenant namespace will automatically get a networkpolicy that allows egress for tracing and ingress for metrics.
You can view these rules by typing:
kubectl get networkpolicies -n <tenant-namespace>
Opentelemetry
To gather opentelemetry data we rely on the grafana agent operator. The grafana agent operator deploys a grafana-agent in a central namespace configured as a part of XKF.
The grafana agent gathers both metrics and logs and is able to receive traces.
Metrics
To gather metrics data we use servicemonitors or podmonitors that is managed in XKF using the prometheus-operator.
The prometheus-operator has a great getting started guide but if you want a quick example you can look below.
In order for the grafana agent to find the pod you have to put this exact label on the pod/service monitor yaml: xkf.xenit.io/monitoring: tenant,
or else the grafana agent will not find the rule to gather the metric.
The selectors is used to find ether the pod or the service that you want to monitor.
Use a podmonitor when you do not have a service in front of your pod. For example this might be the case when your application does not use an HTTP endpoint to get requests.
apiVersion: monitoring.coreos.com/v1
kind: PodMonitor
metadata:
  name: podmonitor-example
  labels:
    xkf.xenit.io/monitoring: tenant
spec:
  selector:
    matchLabels:
      app.kubernetes.io/name: app1
  podMetricsEndpoints:
    - port: http-metrics
In general use a servicemonitor when you have a service in front of your pod.
apiVersion: monitoring.coreos.com/v1
kind: ServiceMonitor
metadata:
  labels:
    xkf.xenit.io/monitoring: tenant
  name: servicemonitor-example
spec:
  endpoints:
  - interval: 60s
    port: metrics
  selector:
    matchLabels:
      app.kubernetes.io/instance: app1
You can do a lot of configuration when it comes to metrics gathering but the above config will get you started.
Logging
To gather logs from your application you need to define a PodLogs object.
Just like metrics you have to define a label like xkf.xenit.io/monitoring: tenant in your PodLogs.
The PodLogs CRD is created by the grafana agent operator and functions very similarly to how the prometheus operator works, especially when it comes to selectors.
Below you will find a very basic example that will scrape a single pod in the namespace where it is created.
apiVersion: monitoring.grafana.com/v1alpha1
kind: PodLogs
metadata:
  name: app1
  labels:
    xkf.xenit.io/monitoring: tenant
spec:
  selector:
    matchLabels:
      app.kubernetes.io/name: app1
  pipelineStages:
    - cri: {}
You can do a lot of configuration when it comes to log filtering using PodLogs. For example you can drop specific log types that you do not want to send to your long time storage.
Sadly the grafana agent operator does not supply great documentation around how to define this configuration in the operator.
However, together with running kubectl explain podlogs.monitoring.grafana.com.spec.pipelineStages on the cluster and
reading the official documentation on how to create pipelines you can get a good understanding of how to create the configuration that you need.
If you do not have any needs to filter or do any custom config per application you can create a namespace-wide PodLogs gatherer.
apiVersion: monitoring.grafana.com/v1alpha1
kind: PodLogs
metadata:
  name: tenant-namespace-log
  labels:
    xkf.xenit.io/monitoring: tenant
spec:
  selector: {}
  pipelineStages:
    - cri: {}
Tracing
The tracing setup is a bit different compared to logging and metrics, instead of having some yaml file where you define how to gather metrics and logs from your application, you instead push data to a central collector.
Opentelemetry supports both HTTP and gRPC communication to gather traces from your application.
To send HTTP data we use 4318 and for gRPC we use 4317.
Point your OpenTelemetry SDK to http://grafana-agent-traces.opentelemetry.svc.cluster.local:4318/v1/traces or http://grafana-agent-traces.opentelemetry.svc.cluster.local:4317/v1/traces.
Tail-based sampling
By default the grafana agent that is deployed by XKF forwards all traces without any special config to your service provider.
This can cause high costs thanks to the amount of data that is sent.
You can configure the agent to use probabilistic sampling which grafana agent delivers their own solution for called tail-based sampling, which can help you solve this issue.
To setup a custom agent with tail-based sampling you can setup your own trace agent with the custom config that you want and then have it forward all the traffic to our central trace agent in the opentelemetry namespace.
Below you can find a simple example configmap that you can use together with your trace agent to send data to the central agent.
kind: ConfigMap
apiVersion: v1
metadata:
  name: grafana-agent-traces
data:
  agent.yaml: |
    tempo:
      configs:
        - name: default
          remote_write:
            - endpoint: "grafana-agent-traces.grafana-agent.svc.cluster.local:4317"
              insecure: true
          receivers:
            otlp:
              protocols:
                http: {}
                grpc: {}
          tail_sampling:
            # policies define the rules by which traces will be sampled. Multiple policies
            # can be added to the same pipeline.
            # For more information: https://grafana.com/docs/agent/latest/configuration/traces-config/
            # https://github.com/open-telemetry/opentelemetry-collector-contrib/tree/b2327211df976e0a57ef0425493448988772a16b/processor/tailsamplingprocessor
            policies:
              - probabilistic: {sampling_percentage: 10}
              - status_code: {status_codes: [ERROR, UNSET]}
Networkpolicy grafana agent
When using XKF and your cluster have enabled the grafana agent your tenant namespace will automatically get a networkpolicy that allows incoming metrics gathering and egress for tracing.
You can view these rules by typing:
kubectl get networkpolicies -n <tenant-namespace>